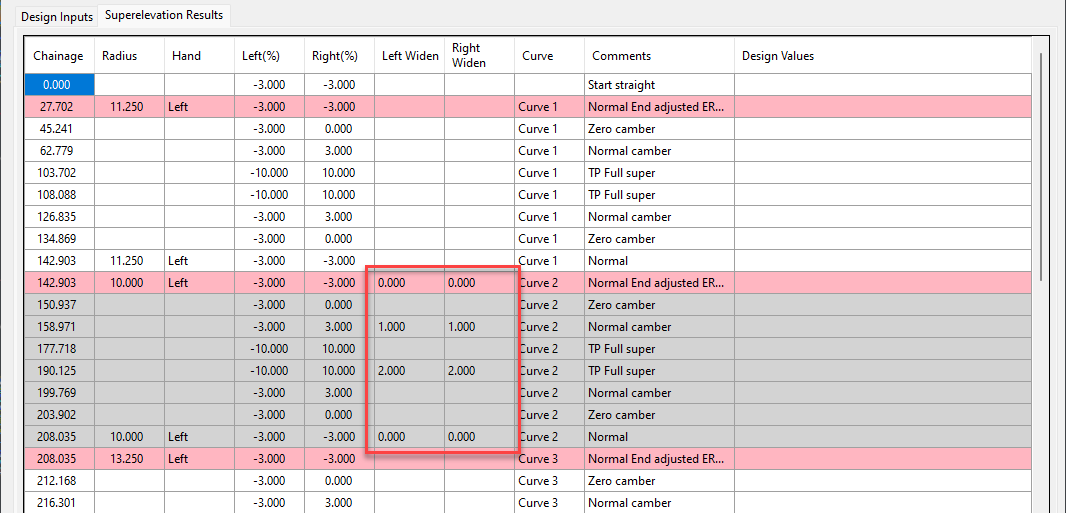
We’ve enhanced the superelevation tools to make it easier for you to quickly and easily assess output of rules-based superelevation, and to make it simple for you to use this tool to vary pavement crossfalls and widths.
To make things easier with rules-based application of superelevation, we’ve colour coded each curve to highlight them, and we’ve colour codes issues with superelevation (like curve radius being too small or overlapping superelevation lengths) with a pink row.

Most importantly, you can easily apply linear transitions of pavement widening and/or pavement crossfall, over any chainage ranges.
Previously, we made you fill out every value (for crossfall or width) where you added a chainage – this made things awkward because if you had a widening going from, say, chainage 100 to 150, but you also had chainage entries at, say, chainage 120 and 130, then you had to manually interpolate what the widths would be at these intermediate chainages.
Now, we interpolate the value at any cell you leave blank. What this means is that you can separately manage the pavement crossfalls or the pavement widening, left and right. Add chainages at the locations where you want the changes to start and stop.

Rather work with Excel? We’ve added file export functionality to push the data out to Excel, and to read the data back in. In Excel you just type in chainages, fill out the key locations with crossfalls and widths, then load it back in.

At times you may need to move your standalone Civil Site Design or Stringer license due to hardware failure, formatting of a workstation (PC) or moving to another PC. Here are the instructions on how to complete this process both if the license is accessible or inaccessible.
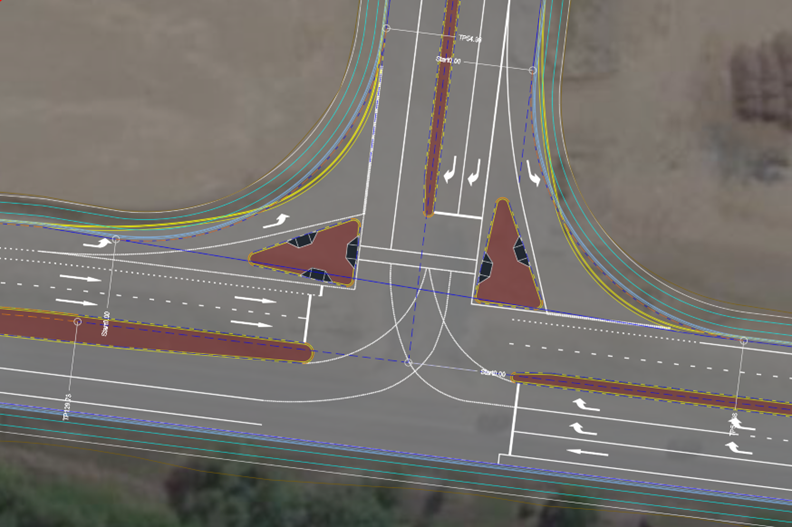
Revolutionise your Civil Site Design with Project Assist: Automating medians and splitter islands effortlessly. This AI-powered tool streamlines island integration by detecting alignments, automatically trimming road strings, and enhancing precision with minimal manual input.
Check out the performance improvements we have introduced for all Civil 3D Corridor creators out there!
Check out the performance improvements we've introduced into Civil Site Design V24.20 when you're working in the Vertical Grading Editor window.


