From V26.20 release you now have the ability to quickly extract a dynamic section view along any polyline. This allows designers to quickly visualise and review their designs without the overhead of creating strings.
This command is super simple to use:
– Create a polyline
– Run the Quick Section command and pick the polyline

In the graphics display panel on the right you will see a dynamic cross section displaying multiple data sources: Surfaces, Built Models, Subgrade Models, Alignments, COGO Points and Pipe Networks.
The left side panel allows you to quickly turn the display of objects on/off and set colours for quick identification.
Move your cursor in the section display and track the position in plan with the dynamic chainage (station) tracker
Display Features
Of course, there are settings for you to control how things display, such as text heights and marker sizes.
Surfaces display the section information along the polyline. You can change the colours with the colour swatch next to each surface.
Models display where strings and codes intersect the polyline. You have the added benefit when displaying Models to optionally report the Code and the Slopes for analysis and review.

Pop into the Settings to turn on/off the display of the codes and slopes, as well as set the text sizes.
This applies both to top surface Built Models as well as Subgrade Models.
Alignments are marked with a vertical line and alignment name.
Turning on Pipe Networks will display wherever pipes in the selected network/s cross the section.
COGO points display with a marker and text with number, description and elevation. You see the offset tolerance to display.
Dynamic Updating and Settings Recall
You can move the polyline to update the section information, and there is a refresh button if you change the data while the form is open.
When you select a polyline and set up what information you want displayed, this information is remembered and will be reapplied when you reselect the polyline.
Quick Output
If you want a quick, simple output in your drawing, just click on the CAD Output button and pick a spot in the drawing. This creates a drafting output of the section information directly in the drawing.

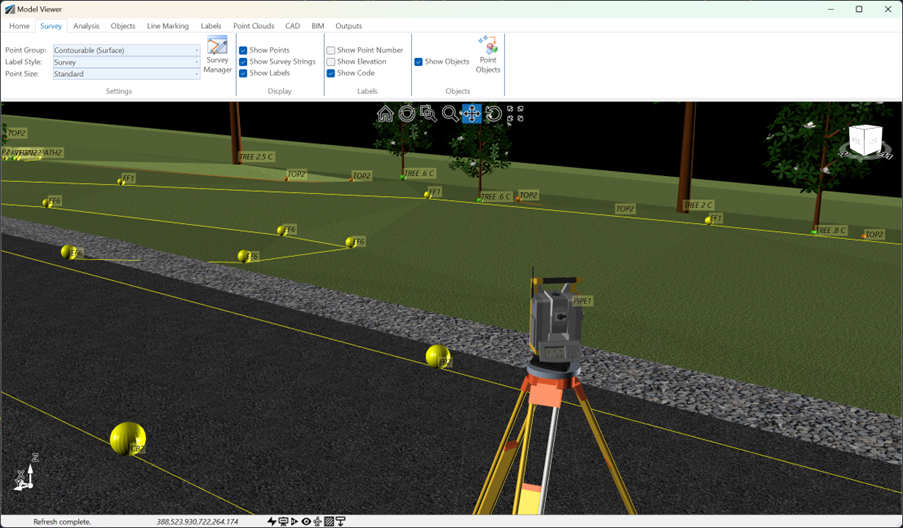
See how Civil Site Design efficiently incorporates and displays survey data, specifically cogo points and survey strings, within your design framework. This article explores this through the lens of a rural road project, demonstrating how cogo points and survey strings from the topographical survey are seamlessly integrated and visualised in Civil Site Design's Cross Section Viewer, VGE (Vertical Grading Editor), and 3D viewer (Model Viewer).
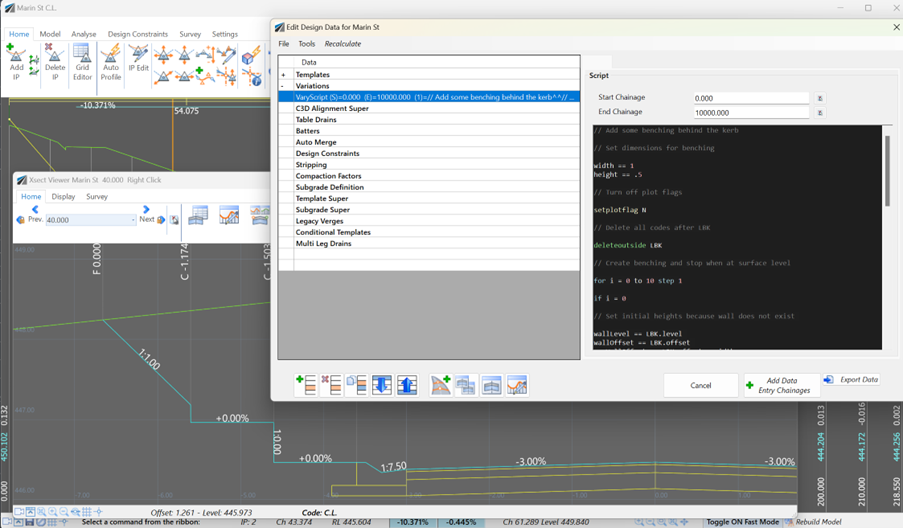
Unlock advanced cross-section editing in Civil Site Design with ScriptX, a user-friendly scripting tool for precision and customization. Easily integrate your scripts into the design process, and collaborate effortlessly with a shared library of scripts. This article will explore ScriptX's capabilities and provide download sample scripts.
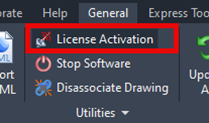
At times you may need to move your standalone Civil Site Design or Stringer license due to hardware failure, formatting of a workstation (PC) or moving to another PC. Here are the instructions on how to complete this process both if the license is accessible or inaccessible.
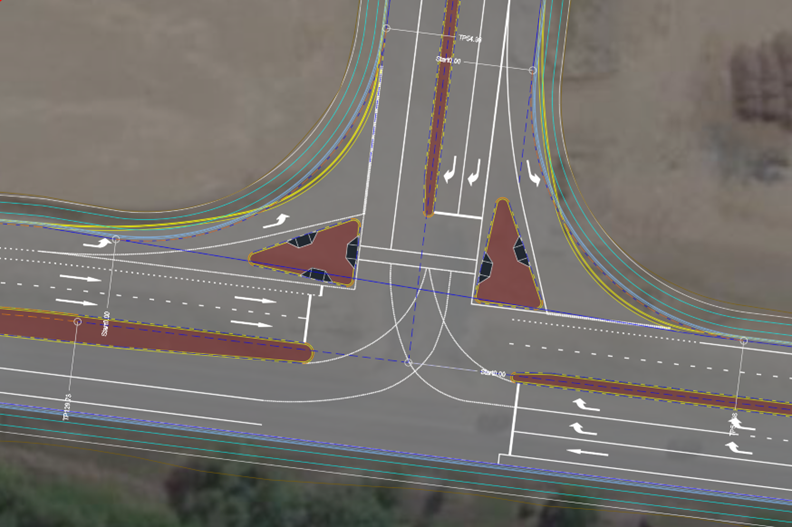
Revolutionise your Civil Site Design with Project Assist: Automating medians and splitter islands effortlessly. This AI-powered tool streamlines island integration by detecting alignments, automatically trimming road strings, and enhancing precision with minimal manual input.