In the realm of civil engineering and design, the ability to accurately reference and visualise existing survey data is crucial, especially in complex projects like road reconstruction. This article delves into how Civil Site Design efficiently incorporates and displays survey data, specifically cogo points and survey strings, within your design framework. Such functionality is crucial in projects that demand acute awareness of existing infrastructure such as kerb strings or pipes. We will explore this through the lens of a rural road project, demonstrating how cogo points and survey strings from the topographical survey are seamlessly integrated and visualised in Civil Site Design’s Cross Section Viewer, VGE (Vertical Grading Editor), and 3D viewer (Model Viewer). This will provide the designer with a comprehensive view of the existing and proposed infrastructure, ensuring more informed decision-making throughout the project lifecycle.
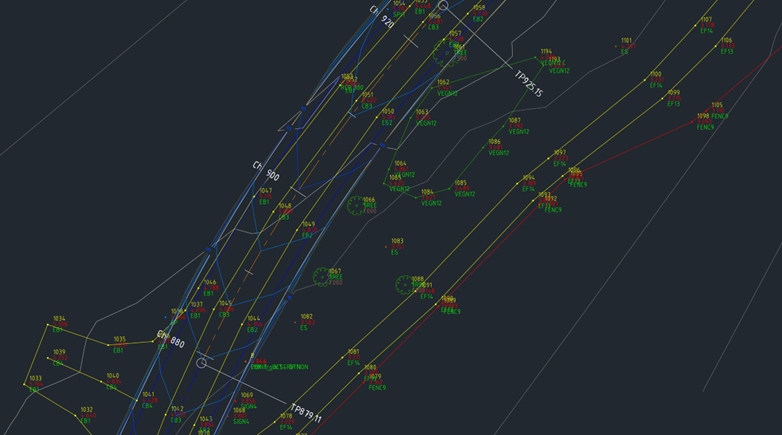
Figure 1: Plan View of Cogo Points and Survey Strings that were created using Stringer Topo.
Cross Section Viewer
By navigating to the ‘Survey’ tab and selecting a Point Group – for our example, we have chosen ‘Contourable’ – users can display both Survey Strings and Cogo Points. Additionally, there is an option to display the elevation text for each Cogo Point. A tolerance setting, which defaults to 5 metres, is utilised to ensure that only the survey data within the offset range is included.
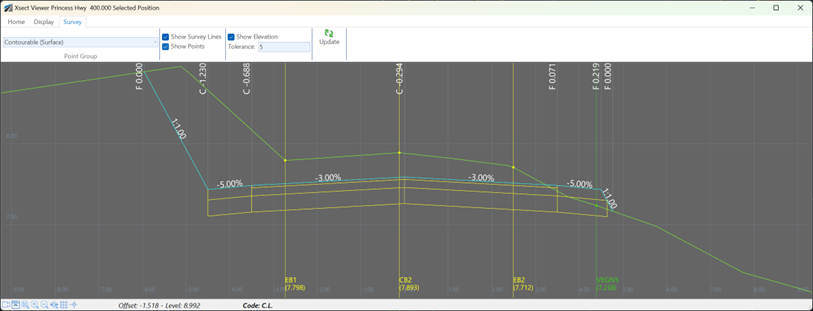
Figure 2: Survey Strings and Cogo Points displayed in the Cross Section Viewer. EB1, CB2, and EB2 represent the existing road formation.
Vertical Grading Editor
Like the Cross Section Viewer, the VGE features a “Survey” tab with nearly identical options. Users can select the desired Point Group and toggle the display of Survey Strings and Cogo Points. The button to update survey data ensures that any changes or edits to the points and strings are reflected in real-time.
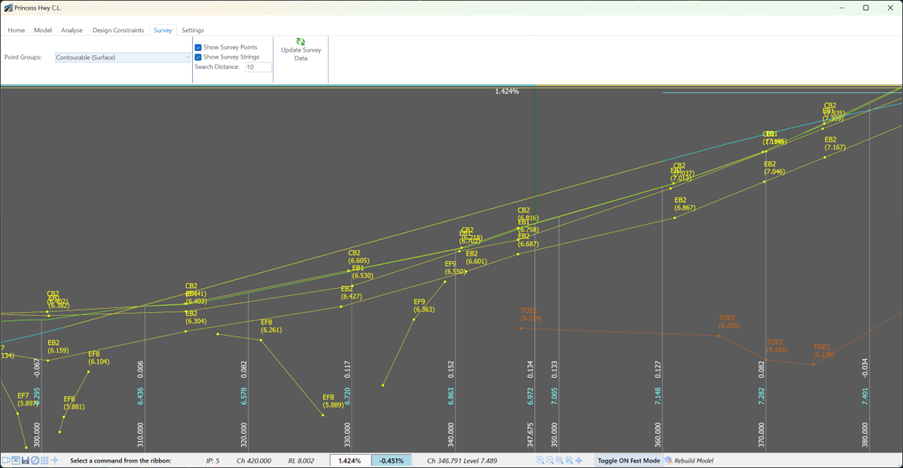
Figure 3: Survey Strings and Cogo Points displayed in the VGE.
Model Viewer
Model Viewer also includes a dedicated ‘Survey’ tab, mirroring the functionality found in the Cross Section Viewer and VGE. To display survey data within the 3D scene, users must firstly select a Point Group. The selection of a label style is also important, as it used for the presentation of Cogo Point information within the scene. It is essential in the Display panel to activate the ‘Show Cogo Points’ and ‘Show Survey Strings’ options, ensuring that this data is visible in the 3D visualisation.
A particularly notable aspect of Model Viewer is its capability to present 3D models or cutouts at designated Cogo Points. By applying codes such as ‘TREE’ or ‘STN’, users can visualise elements like trees and Total Stations in a 3D format. The software adeptly scales these models in accordance with data stored on attributes like height or width.
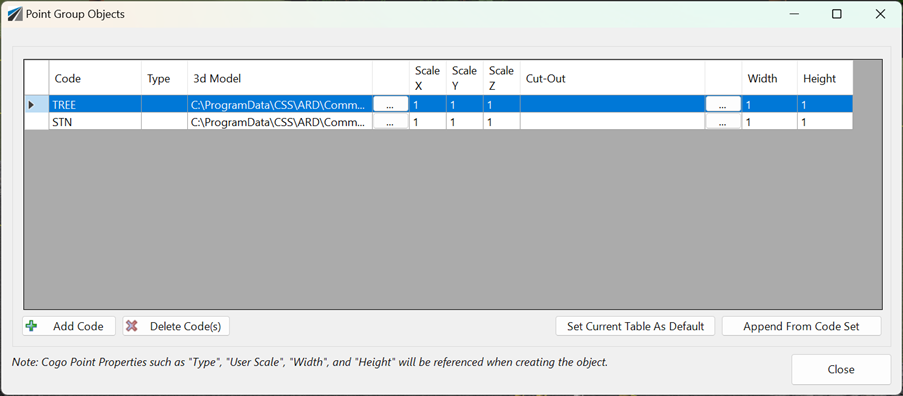
Figure 4: Interface for Assigning 3D Models or Cutouts to Cogo Points – This image displays the intuitive interface within Civil Site Design’s Model Viewer where users can assign specific codes to Cogo Points, enabling them to be represented as detailed 3D models or cutouts.
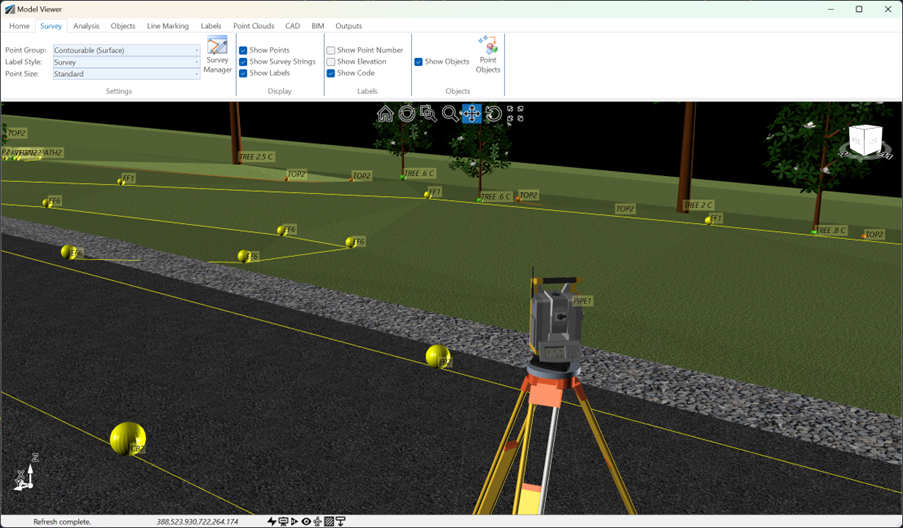
Figure 5: Display of Survey Strings and Cogo Points in Model Viewer – This image captures the 3D visualisation of Survey Strings and Cogo Points within Model Viewer, including detailed 3D models of a tree and a total station. It also presents a fully rendered rural road design, effectively illustrating the integration of both existing and proposed infrastructure.
Referencing Civil 3D Cogo Points in Civil Site Design
For users of Civil Site Design for AutoCAD Civil 3D, there is the added benefit of being able to reference Civil 3D Cogo Points directly. The ‘Civil 3D Point Group Link’ feature in Civil Site Design facilitates the creation of a specialised Point Group within Civil Site Design that directly links to and references a Civil 3D Point Group, ensuring seamless integration and data consistency between the two applications.
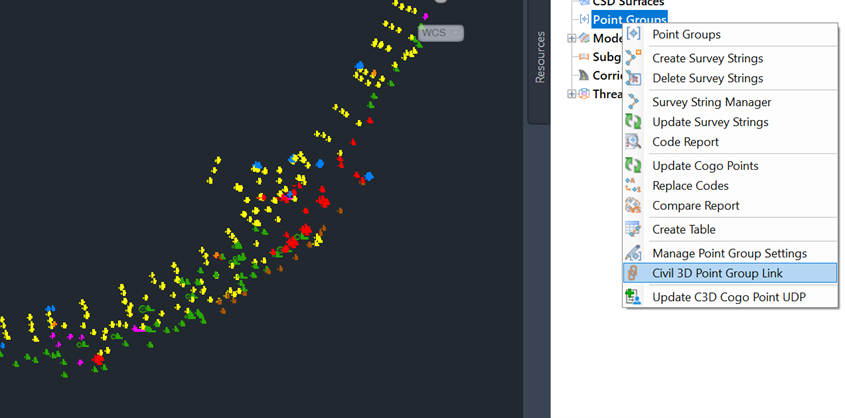
Figure 6: This screenshot illustrates how the “Civil 3D Point Group Link” command can be accessed from the Civil Site Design toolspace, providing a straightforward method for linking Civil 3D and Civil Site Design data.
Upon displaying the Civil 3D Point Group Manager, it is important to set the “Status” for the “Contourable” Point Group to “Linked”. Following this, selecting “Create/Update” will generate a Civil Site Design Point Group that mirrors the Civil 3D Point Group.
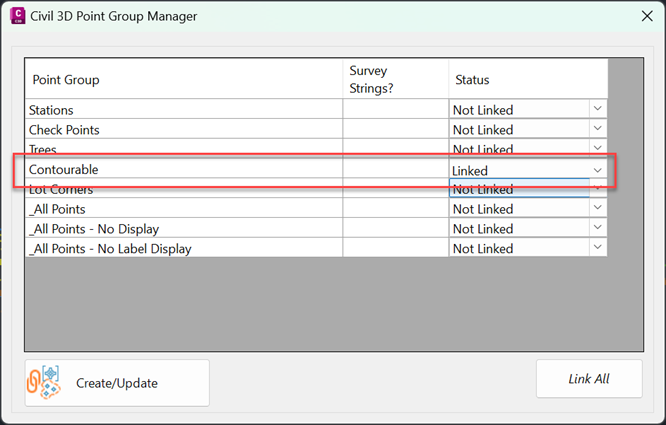
Figure 7: The screenshot here displays the Civil 3D Point Group Manager, showcasing the process of linking and creating Point Groups.
Once the Point Group is established, Survey Strings can be created with ease. Simply right-click on the Point Groups heading in the CSD toolspace and select “Create Survey Strings”.
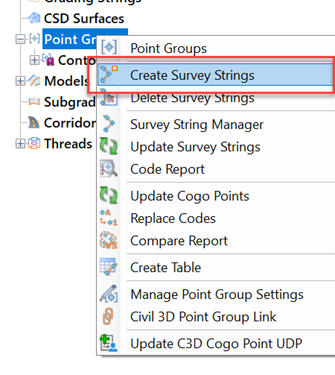
Figure 8: This screenshot demonstrates the “Create Survey Strings” command within the toolspace, highlighting how users can seamlessly generate Survey Strings from the linked Point Groups.
With these steps completed, we now have a CSD Point Group that comprises both Cogo Points and Survey Strings. These can be effectively displayed in the Cross Section Viewer, VGE, and Model Viewer, offering a comprehensive and integrated approach to handling survey data in Civil Site Design.
Conclusion
Civil Site Design significantly enhances the capability of civil designers to display and interpret survey data within their projects. Through its intuitive interface and powerful tools, such as the Cross Section Viewer, VGE, and Model Viewer, the software allows for a detailed and comprehensive visualisation of Cogo Points and Survey Strings. This functionality not only simplifies the process of integrating survey data into designs but also ensures that designers can make well-informed decisions based on a clear and accurate representation of existing and proposed infrastructures.